 Source : A Visual Guide to the Search for Exoplanets – Scientific American Blog Network
The perfect holiday present: a kids’ book that teaches rocket science – The Verge
Science Museum Brings To Life Classic Stop-Motion Creatures | KGOU
A cyclops, a sea monster and a three-headed dog guard the office of Scott Henderson, a gallery director at the Science Museum Oklahoma. The handmade
Source : Science Museum Brings To Life Classic Stop-Motion Creatures | KGOU
The Evolution of a Scientific American Graphic: Pregnancy in Progress – Scientific American Blog Network
When we return to a topic where the research has advanced, our visual explanations need to be updated accordingly
Nearly 900 People Have Won Nobel Prizes. Only 48 Were Women.
We crunched the numbers on 115 years’ worth of past prize winners, and the data revealed some striking trends.
Source : Nearly 900 People Have Won Nobel Prizes. Only 48 Were Women.
Graphic window on a refugee scientist : A view From the Bridge
Graphic artist Erik Nelson Rodriguez is an innovative comics journalist. With reporter Darryl Holliday, he began creating nonfiction stories in graphic-novel form at university, covering issues such as gun violence.
Source : Graphic window on a refugee scientist : A view From the Bridge
Graphic design for scientists : Nature Nanotechnology : Nature Research
Drawing a clear and compelling figure is vital in science communication, so Karen Cheng and Marco Rolandi set up a help desk for scientists and engineers to consult with design students.
Source : Graphic design for scientists : Nature Nanotechnology : Nature Research
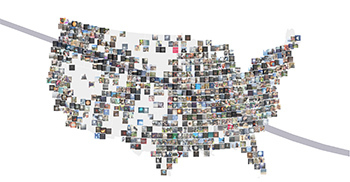
#eclipse2017: Most popular Instagram photos of the solar eclipse – Washington Post
Even without a map, you can see the effects of the eclipse over an area. Photos uploaded to Instagram under #eclipse2017 quickly spiked when the umbra — the shadow cast by the moon completely blocking out the sun — began its trip over the Oregon coast.
Source : #eclipse2017: Most popular Instagram photos of the solar eclipse – Washington Post
Visualizing Sex as a Spectrum – Scientific American Blog Network
The project abruptly transformed into an exercise in visualizing complexity. First, it seemed imperative to define a few terms. Sex, gender, and sexuality are all distinct from one another (although they are often related), and each exists on its own spectrum.
Source : Visualizing Sex as a Spectrum – Scientific American Blog Network
How Science Visualization Can Help Save the World
“we must find ways to further engage and grow our audience. For those who are already interested and science literate, we need to inspire them to engage with science at higher levels”
Information graphics and the fight for science in Trump’s America

/cdn.vox-cdn.com/uploads/chorus_image/image/57657813/Rocket_banner.0.jpg) Source :
Source : 
